 Blade API Monitor 3.7.9.6
Blade API Monitor, a developer spy tool, can trace and log API and ActiveX interface with parameters. It can trace any exported functions of any DLLs, log all API call information, predefine 8000+ APIs' prototype, and it supports MAP PDB Files, etc.
Last update
4 May. 2013
| old versions
Licence
Free to try |
$79.00
OS Support
Windows 2000
Downloads
Total: 1,286 | Last week: 3
Ranking
#132 in
ActiveX
Publisher
Blade Api Monitor
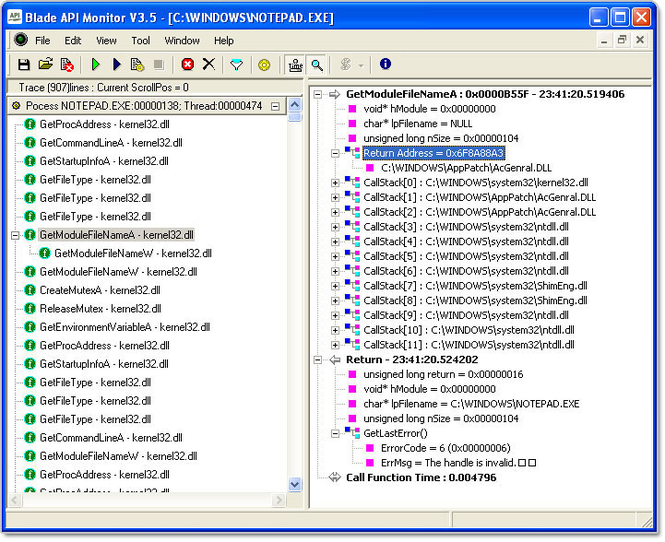
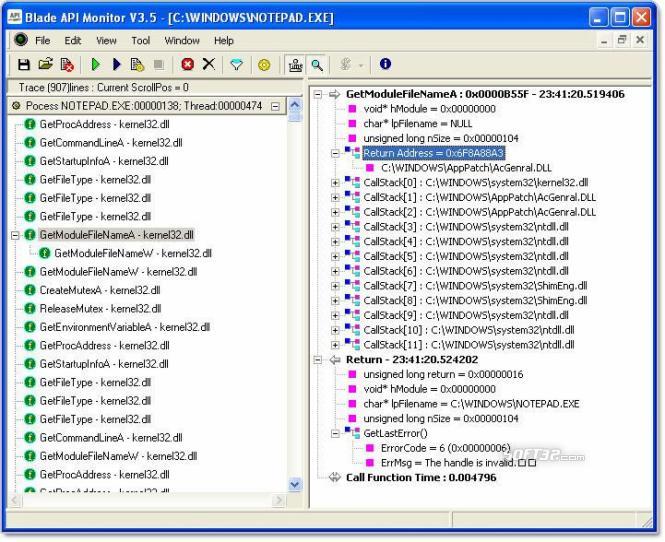
Screenshots of Blade API Monitor
Blade API Monitor Publisher's Description
Blade API Monitor is a useful developer spy tool which can trace and log API and ActiveX interface with parameters. The key features are:Trace any exported functions of any DLLs, including Windows API and any other 3rd-Part APIs, unnecessarily to know the prototype of the functions;Trace NT Native API and undocumented APIs;Trace MFC Class method, including MFC42 MFC80 MFC90;Trace ActiveX controls and COM objects interfaces;Trace internal functions code with Map (MSVC, DELPHI, C++Builder, IDA, ...) File;Trace functions in source code with PDB (MSVC) and source files;Log all API call information, including function name, call sequence, start time, return time, call stack, thread id, input and output parameters, function return value, GetLastError code, OutputDebugString, exception, CPU context and more;Support debug version and release version with no modifications to the target application; Support Unicode and ANSI application;Support multi-thread;Presets 27 API Filter Profiles, including Handles and Objects, Dynamic-Link Libraries, Event Log, Pipes and Mailslots, Debugging, Windows Classes, COMM, Application Related, Shell, Dialog Boxes, File System, Services Related, Remote Access Service, Memory Management, Print Related, Windows, Registry, Processes and Threads, File IO, WinInet, Windows Sockets, Multimedia API, Windows GUI, Network Management, WinNT Security, Access Control Functions;Easily generate PDB files without source code;Support Script Macro;Predefine 8000+ APIs' prototype.
What's New in Version 3.7.9.6 of Blade API Monitor
Some bugs fixed
Look for Similar Items by Category
Feedback
- If you need help or have a question, contact us
- Would you like to update this product info?
- Is there any feedback you would like to provide? Click here
Beta and Old versions
Popular Downloads
-
 Athan
4.5
Athan
4.5
-
 Kundli
4.5
Kundli
4.5
-
 Macromedia Flash 8
8.0
Macromedia Flash 8
8.0
-
 Cool Edit Pro
2.1.3097.0
Cool Edit Pro
2.1.3097.0
-
 Hill Climb Racing
1.0
Hill Climb Racing
1.0
-
 Cheat Engine
6.8.1
Cheat Engine
6.8.1
-
 Grand Theft Auto: Vice City
1.0
Grand Theft Auto: Vice City
1.0
-
 Tom VPN
2.2.8
Tom VPN
2.2.8
-
 Grand Auto Adventure
1.0
Grand Auto Adventure
1.0
-
 HTML To PHP Converter
6.0.1
HTML To PHP Converter
6.0.1
-
 Zuma Deluxe
1.0
Zuma Deluxe
1.0
-
 Netcut
2.1.4
Netcut
2.1.4
-
 Vector on PC
1.0
Vector on PC
1.0
-
 Iggle Pop
1.0
Iggle Pop
1.0
-
 Windows XP Service Pack 3
Build...
Windows XP Service Pack 3
Build...
-
 Minecraft
1.10.2
Minecraft
1.10.2
-
 Ulead Video Studio Plus
11
Ulead Video Studio Plus
11
-
 Horizon
2.9.0.0
Horizon
2.9.0.0
-
 Auto-Tune Evo VST
6.0.9.2
Auto-Tune Evo VST
6.0.9.2
-
 C-Free
5.0
C-Free
5.0